Custom Made Wheel Force Transducer (WFT):
Note: This is only a brief summary of a very complex project. A full report including, CADs, FEA results, PCB schematics, etc. can be downloaded here!
Problem Statement:
For the entirety of my undergraduate career, my friends and I, led an off-roading Baja SAE race team where we would design, manufacture, and test our custom made cars.
In order to design automotive components with a satisfactory lifespan (and avoid costly overdesign), the forces and moments experienced by each component (and, by extension, the entire car) must be understood.
Easier said than done! As there are near infinite loading conditions that the car experiences on an off road course. In essence, year after year, we were guessing (with varying degrees of success) the maximum loading conditions experienced by the car.
In industry, automotive companies use what's called a wheel force transducer (WFT). This instrument, often containing strain gauges on what's called the transducer body, is mounted to a car's wheel hub. The strain gauges output electrical signals that are recorded and converted into three-axis forces and three-axis moments experienced by the wheel. These readouts (from a test drive) can then simply be plugged into an FEA simulation to understand the forces and moments experienced by the car and its components.
There was just one issue... These instruments often cost well over $75,000 USD, more than our annual budget. My partner and I believed we could make one for under $1000 USD.
The Inspiration and Discovery of The Holy Grail:
Not surprisingly, there is not a whole lot of open source information and designs around WFTs. The few companies that make WFTs keep their trade secrets close to their chest. But I did strike gold finding Dr. Feng's paper, “Design and optimization of a self-decoupled six-axis wheel force transducer for a heavy truck."
Dr. Feng's work would become the starting point for our project. His concept (imaged to the left) comprises of a strain plate (image a) that includes eight elastic columns/spokes. Each spoke houses four strain gauges (one on each face) which are then arranged into six Wheatstone bridges (image b). Each Wheatstone bridge corresponds to one of the six force/moment axes

Feng proposes the use of a Wheatstone bridge (image b), for each of the six outputted forces/moments for a universal WFT
(𝑭̅ = [𝐹𝑥, 𝐹𝑦, 𝐹𝑧 , 𝑀𝑥, 𝑀𝑦, 𝑀𝑧 ]) but only records the strain vector 𝑺̅ = [𝑆𝐹𝑥 , 𝑆𝐹𝑦 , 𝑆𝐹𝑧 , 𝑆𝑀𝑥 , 𝑆𝑀𝑦 , 𝑆𝑀𝑧 ]. Feng suggests creating a 6x6 matrix which he refers to as a compliance matrix (C) to calculate the force vector (𝑭̅) using the recorded strain vector (𝑺̅). The constants in the compliance matrix would have to be deduced by creating and using some sort of calibration jig.
Mechanical Design:
As seen in the images below, Feng's eight spoke (32 strain gauge) design was used as inspiration. However, the design still needed to be scaled to the relatively small size of our single passenger off road vehicle with appropriate mounting that interfaced with our already existing car.
Referring to the exploded view below, our design transfers the force experienced by the hub and rim into the eight 7075-T6 aluminum elastic columns of the strain plate through the 7075-T6 aluminum hub adapter, 7075-T6 aluminum wheel spacers, and their corresponding fasteners. As discussed in further detail in coming sections, the PCB collects each sample of strain data and organizes it into a strain vector (𝑺̅ = [𝑆𝐹𝑥 , 𝑆𝐹𝑦 , 𝑆𝐹𝑧 , 𝑆𝑀𝑥 , 𝑆𝑀𝑦 , 𝑆𝑀𝑧 ]) using six Wheatstone bridges – one for each primary axis of force/moment. This data is saved onto an SD card (on the PCB) that can then be uploaded (via Wi-Fi) and processed in MATLAB to output force vectors (𝑭̅ = [𝐹𝑥, 𝐹𝑦, 𝐹𝑧 , 𝑀𝑥, 𝑀𝑦, 𝑀𝑧 ]). These force vectors are solved using the equation 𝑺̅ = 𝐶 ∙ 𝑭̅, where 𝐶 (as mentioned earlier) is a 6×6 matrix of constants predetermined during tuning and calibration.

Exploded assembly view of all WFT components that were designed and manufactured.
Using historical estimations of max forces and moments experienced by the wheels (1000lbf radial load, 500lbf lateral load, and 1000lbf amplitude cyclic force) I was able to conduct FEA simulations that were later iterated with force and moment data from the completed WFT. Applying said radial and lateral load the FEA produced a minimum Von Mises fast fracture FOS of 2.26, far exceeding our desired goal of 1.5.
Similarly, the fatigue life was assessed using the stated cyclic load of 100lbf. Our initial goal was 896,000 cycles which we roughly equated to 32 testing/working hours. It should be noted that SOLIDWORKS fatigue analysis program outputs a damage percentage for a given number of test cycles (FOS of 1), where a 100% damage indicates failure prior to (or on) cycle number 896,000. In this case, the maximum damage percentage seen for the design was 11.4%. To better assess the success of these results, the number of cycles until failure can be found by referencing the S-N curve for 7075-T6 (imaged above). To do this, the same test parameters for cyclic loading were inputted and a plot outlining the maximum endurance limit was created. As seen above, a maximum endurance limit of 224MPa was found along the bolt hole connecting the strain plate to the rim of the car. Cross referencing this with the S-N curve, it can be said that this model is predicted to fail (roughly) on cycle number 1,250,00 (or 44.6 working hours), once again far exceeding our original goal of 32 hours.
PCB Design and Software Development:
Note: as mentioned at the top of this page, a detailed report out including PCB schematics, BOMs, as well as pseudocode can be found here.
As mentioned earlier, the PCB is to collect each sample of strain data and organize it into a strain vector (𝑺̅). This data is saved onto an SD card that can then be uploaded (via Wi-Fi) and processed in MATLAB to output force vectors (𝑭̅).
As seen in the schematics below the following hardware was used: A Teensy 4.1 microcontroller (the work horse of the PCB community) to execute our code. An ESP32 for its Wi-Fi and Bluetooth capabilities to transmit the collected strain vectors. A AS5600 magnetic encoder (with 12 bit accuracy) to assign a relative position of these vectors. Additionally, INA2332 instrumentation amplifiers were applied to all six Wheatstone bridges.


Completed PCB board mounted to the strain plate with all 32 strain gauges mounted and connected.
All of the code for both the Teensy 4.1 and ESP32 was made in the C++ language using Visual Studio Code with the PlatformIO extension. By using a common header file for communication constants the code was made more robust.
The images above detail the general flow of both programs. As mentioned earlier the ESP32 handles wireless communication of data (the strain vectors) recorded by the Teensy 4.1. Wireless functionality was a necessity to make logging and labeling of files in the field quick and convenient between test rides. Files are also date/time stamped automatically based on the system time of the device connected, meaning no real time clock or GPS module is required. This timestamp is also used with the team’s data viewer to synchronize any videos with the graphs.
Manufacturing and Assembly:
All mechanical drawings for the WFT, as well as the machining itself, were completed by myself. As seen in the images below, the adapter plate (made from cylindrical stock) was first turned down to its overall diameter on a lathe before being cut to a rough length on the vertical saw. The part was then dialed in on a rotary table fixed to the work space of a 3 axis mill. On the mill, remaining material was removed to form the star shape before holes were tapped. The spacers were turned down quickly and easily on a standard metal lathe before being parted on the same lathe.
The strain plate was actually first cut into its cylindrical shape from rectangular stock (via laser cutting) to save costs on the high price of 7075-T6. Once cut, using the .STEP file I created, the remaining material was removed in a CNC mill in a single fixture/clamping setup with different radii tools already mounted in its turret.

The PCB was sent out to PCBWay for the wafer to be manufactured using the Gerber files developed by my partner and I. From there we both took part in the tedious work of soldering the surface components and gluing 32 strain gauges using a jig I designed and 3D printed.
Calibration Jig and Testing
As mentioned earlier, in order to process the strain vectors (acquired by the strain gauges) into force vectors, a 6x6 matrix of constants (the compliance matrix) must be solved as 𝑺̅ = 𝐶 ∙ 𝑭̅. To do this, a known force/moment, has to be applied to the hub assembly of the car. As shown in the image below, six different configurations must be loaded to get a force and moment in the X,Y, and Z axes to solve the compliance matrix.
To do this, I designed a jig that was compatible with the weld table we had available to us in our garage. As seen in the images below, I designed, machined, and welded a multi point pulley and clamping system. The custom made C-clamps (where the load will be applied to the hub) had three mounting positions, the upper and lower positions are used to induce a moment, whereas the middle mounting position is perfectly inline with the strain plate and hub to induce force.

A known force and moment must be applied to the pictured hub in each of the 3 axes.
Seen in images above, a known mass is attached to the c-clamp, and redirected with the pulley system. This simple (and cost effective system) allows us to calculate the applied force (knowing the mass suspended) and moment by knowing the offset of the C-clamp positions. Having now a measured strain vector (𝑺̅) and a known force vector (𝑭̅) we were able to solve for C where 𝐶 = (𝑭̅^-1) ∙ 𝑺̅. The resulting values of the 6x6 compliance matrix and their resulting R squared value after extensive testing can be seen above.
Final Results
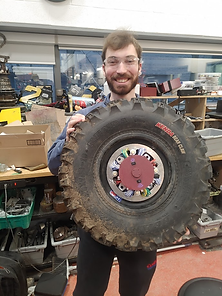
After eight months of R&D my partner (imaged to the right) and I completed our project and set out to test it. The image below shows one of the many data test runs that were performed with the WFT. The top left graph shows forces in the X,Y,Z axes, the top right graph shows moments in the X,Y,Z axes, whereas the bottom left graph simply shows engine RPM.
These graphs (thanks to the timestamped data) was able to be synced up to videos of test runs. The black bar in each of the graphs indicates when the forces are being experienced relative to the video in the bottom right. As you can see the rear wheels (where the WFT is located) are just about to hit the curb at a high RPM, the resulting quantifiable spike in force and moments are then seen (and recorded) shortly after the black bar.
Additionally, thanks to many resources available to us, the cost of this project was well under $1000, a huge cost savings when compared to the few WFTs that are available on the market for over $75,000.
A complete budget break down can be found in the report here.